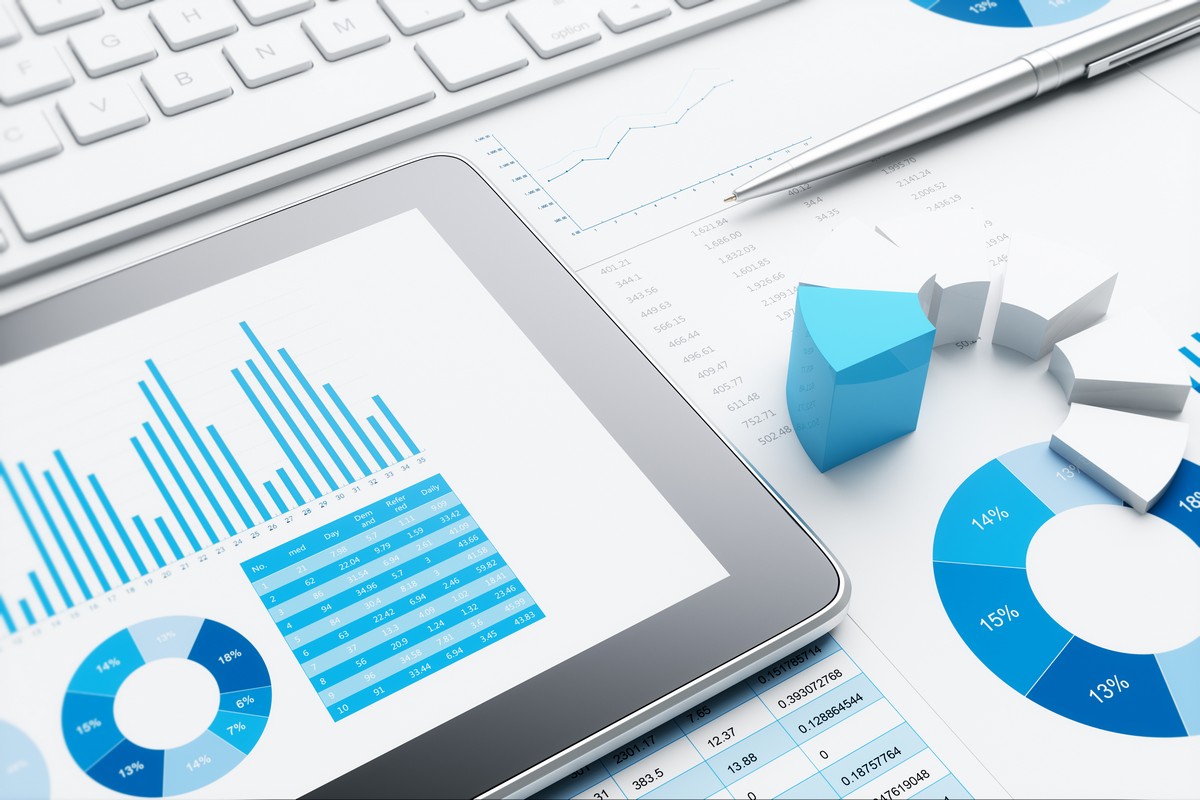
As a general rule, most business people are surrounded by data. We enter it into lots of systems, keep it in notebooks or maybe we create a spreadsheet or two. Your financials, like your profit and loss or balance sheet report are pretty handy at telling you what has happened and that’s pretty valuable information. It doesn’t stop there though.
You often need more non-financial data in addition to financial data so you can identify what’s going on, and make predictions. or just make decisions based on something other than a guess.
You absolutely need good financial data to make sure you fulfil your tax and reporting obligations. You need good analysis because business risk exists. We all face risk to our business, but at the heart of it, risk represents the impact of what we don’t know for certain. We can mitigate risk through good quality analysis and understanding. That means understanding the environment and ourselves by utilising information to underpin
Of course, all this analysis is no use unless it comes to you in a way that is easy to understand. this is an area we know you will love – Contact us to find out more.
One Page Reporting
Because time in business is precious, creating a report on your business on just one page allows you to focus on only the important things. We create these with you and whilst they are easy to read, we also help you to interpret and decide on what is important if asked.
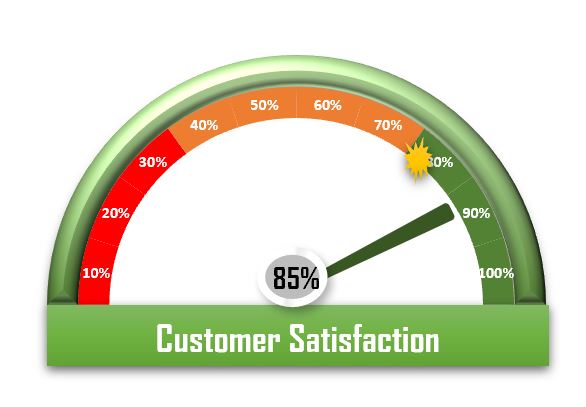
Key Performance Indicators (KPIs)
We know that non-financial measures are just as important as financial measures. KPIs are leading indicators, meaning they measure behaviours, which lead to results.
Types of Analysis
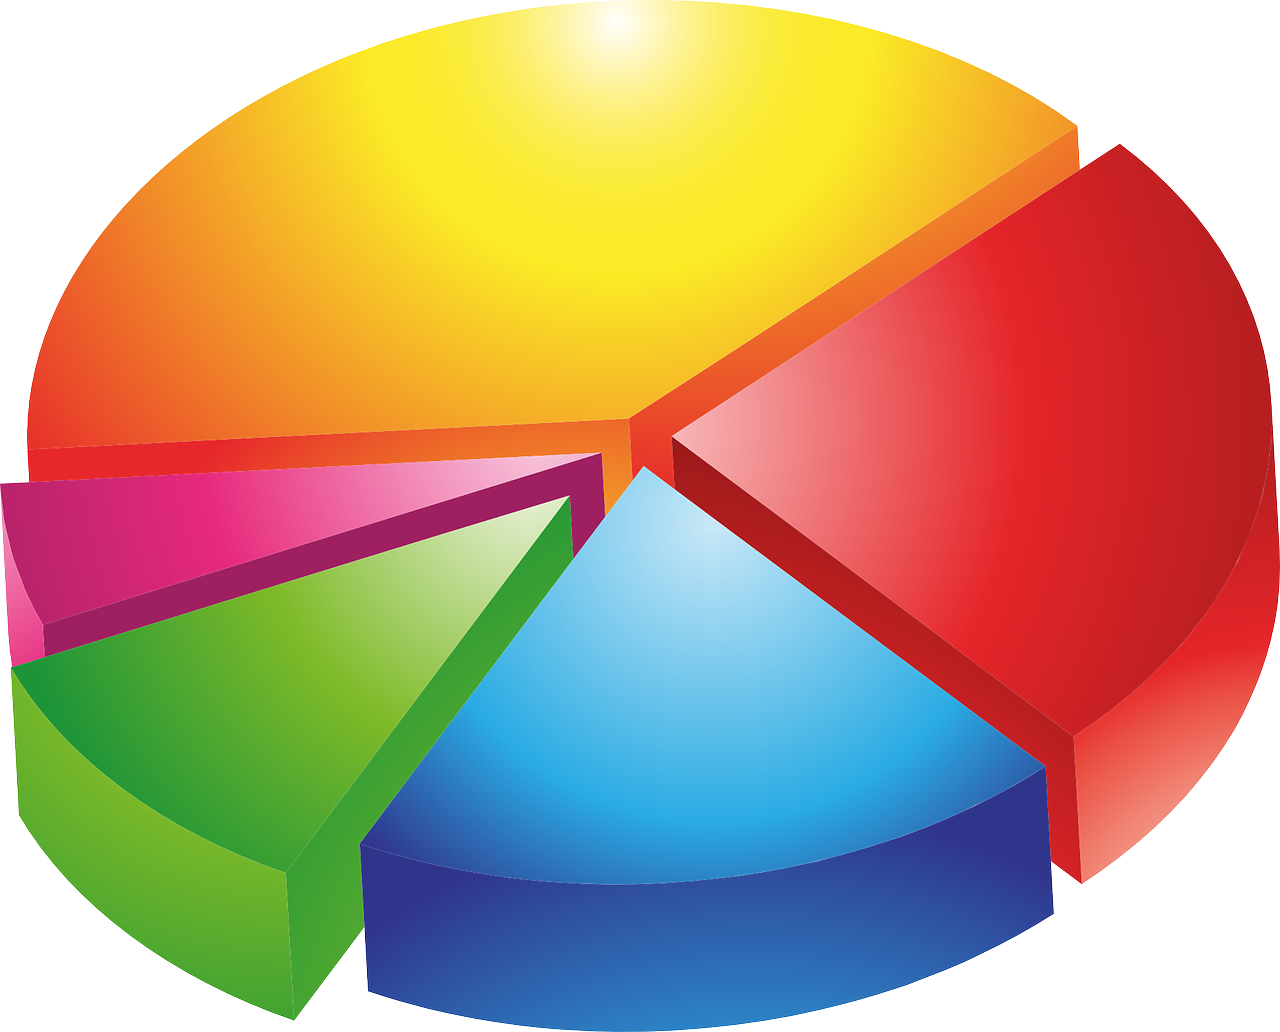
Vertical Analysis / Ratios
I like to think of these ratios as being about relationships between things. Knowing what parts of your business impact other parts the greatest helps you avoid mistakes and is a great foundation for identifying key strengths.
These come in various categories, and when compared to budgeted ratios and benchmarks, can provide great insight into the workings of your business. Below are some of the key categories.
Performance Ratios
Liquidity
Financial Strenth
Relationship Reporting
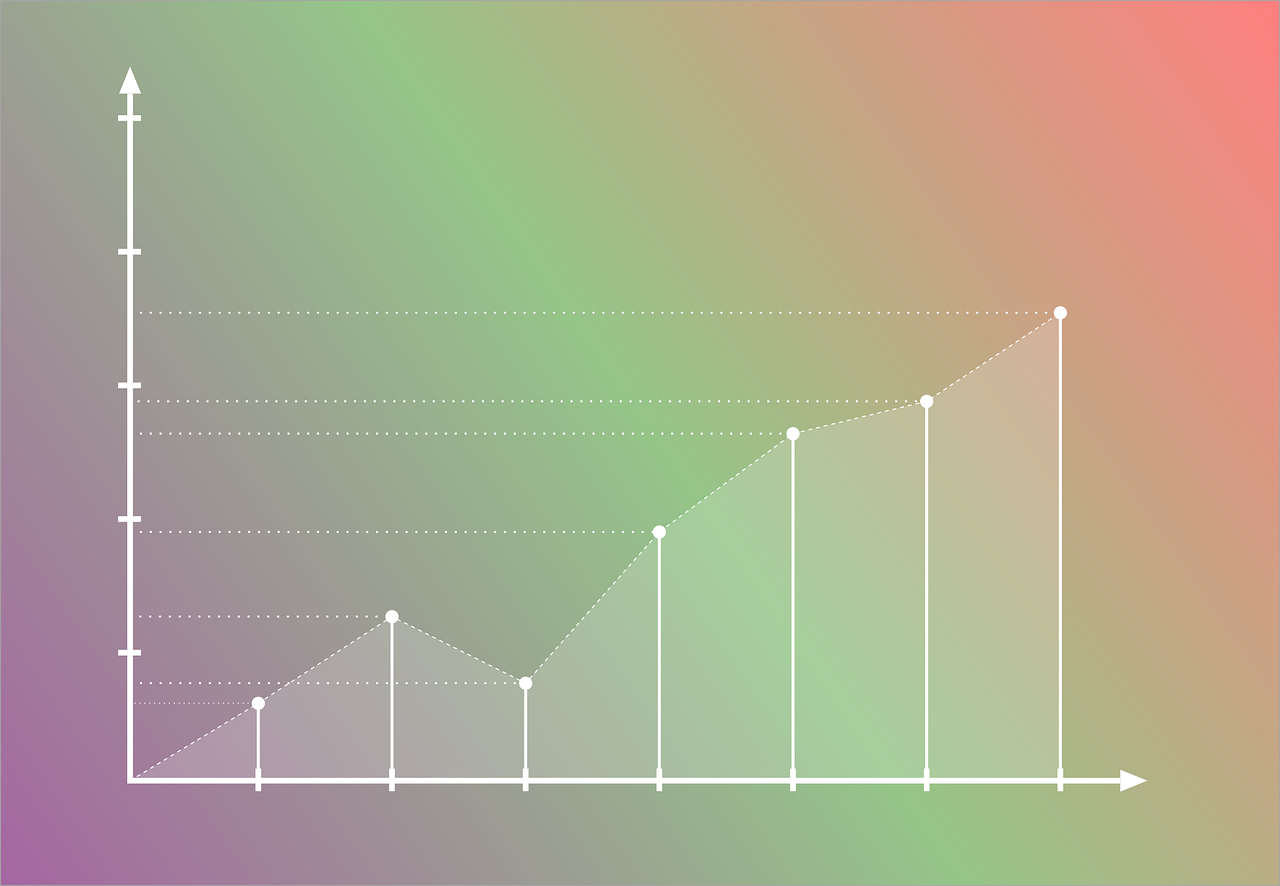
Trend Analysis
Horizontal / Time Analysis
I like to think of these ratios as being about relationships between things. Knowing what parts of your business impact other parts the greatest helps you avoid mistakes and is a great foundation for identifying key strengths.
Statistical Analysis
If you really want to better understand your business and its relationship to the outside world, there’s also a whole range of statistical analysis using tools such as: